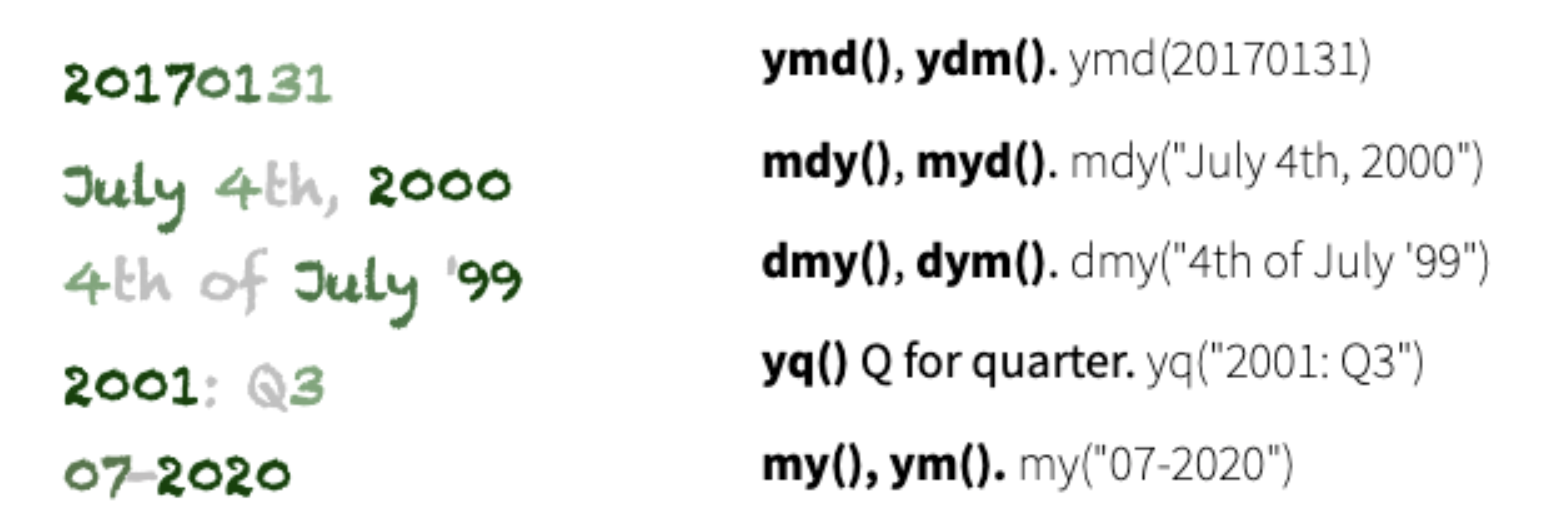
class: center, middle, inverse, title-slide .title[ # Dates and times ] .author[ ### Will Ju ] --- class: middle, inverse, center # Working with date and time --- # `lubridate` package - package for working with dates and times - defines different classes of time: instants, periods, intervals, durations - defines converter and accessor functions, enables time calculus --- # Converter functions and instants in time - time instants: one (absolute) moment in time, e.g. `now()` - easy-to-use converter functions: - date: `ymd`, `mdy`, `dmy`, ... - time: `hm`, `hms`, ... - date & time: `ymd_hms`, `mdy_hm`, ... - order of letters determines how strings are parsed - separators are automatically determined, then assumed to be the same Example: ```r mdy("10-17-2022") ``` ``` ## [1] "2022-10-17" ``` --- # Conversion functions [lubridate package cheat sheet](https://github.com/rstudio/cheatsheets/raw/main/lubridate.pdf)  --- class: inverse # Your Turn - Create date objects for today's date by typing the date in text format and converting it with one of the `lubridate` converter functions. - Try different formats of writing the date and compare the end results. --- # Example: Ames Liquor Sales ```r # url <- "https://github.com/ds202-at-ISU/materials/blob/master/03_tidyverse/data/ames-liquor.rds?raw=TRUE" # download.file(url, "data/ames-liquor.rds", mode="wb") ames <- readRDS("data/ames-liquor.rds") summary(ames$Date) # pretty uninformative ``` ``` ## Length Class Mode ## 661945 character character ``` ```r ames$Date <- lubridate::mdy(ames$Date) summary(ames$Date) # allows time algebra ``` ``` ## Min. 1st Qu. Median Mean 3rd Qu. Max. ## "2012-01-03" "2014-12-22" "2017-08-30" "2017-07-24" "2020-03-12" "2022-09-29" ``` --- # Accessor functions - accessor functions: `year`, `month`, `week`, `wday`, `mday`, `yday`, `hour`, `minute`, ... - accessor functions can also be used for setting elements of date and time, e.g. `hour(x) <- 12` Examples: ```r month(now()) ``` ``` ## [1] 6 ``` ```r wday(now(), label = TRUE) ``` ``` ## [1] Mon ## Levels: Sun < Mon < Tue < Wed < Thu < Fri < Sat ``` --- # Intervals and Durations - Intervals have a *start* and an *end* date/time: absolute difference - Durations are potentially of relative length (months, leap year, leap second, ...) ```r end_date <- now() start_date <- end_date - years(1) end_date - start_date ``` ``` ## Time difference of 365 days ``` --- class: inverse # Your Turn: Iowa Liquor Sales (cont'd) Use the `ames` data to answer the following questions: - give a visual breakdown of the number of sales by year. Is there a pattern recognizable? Does that pattern change when considering the volume of alcohol sold? - find the weekday associated with each date in the data. Introduce a variable `weekday` into the dataset. What is the number of sales by weekday? What is the volume of alcohol sold? Does that pattern hold over the years? --- # Example: Liquor Sales (cont'd) Is there a seasonal effect in the number of liquor sales? VEISHEA used to be a weeklong student festival during April. It got cancelled in August 2014 after riots in April. ```r library(lubridate) ames %>% ggplot(aes(x = month(Date, abbr = TRUE, label=TRUE), weight = `Volume Sold (Gallons)`/1000)) + geom_bar() + facet_wrap(~year(Date), ncol = 6) + ylab("Volume of alcohol sold (in thousands of Gallons)") ``` <!-- --> --- class: inverse # Your Turn (10 min) - find the number of alcohol sales and volume sold on each day over the time frame. What is the average number of sales each day? - Why are there no 0s in the data? Does that change your assessment of the average number of sales per day? - Challenge: use the functions `seq.Date` and `complete` to introduce days into the dataset with no sales. Start by reading the help files for the functions ... <!-- ```r ames %>% mutate( Date = mdy(Date) ) %>% complete(Date = seq(from=ymd("2012-01-01"), to =ymd("2022-09-30"), by="day")) %>% #head() group_by(Date) %>% summarize(n = sum(!is.na(City))) %>% summary() ``` ``` ## Warning: There was 1 warning in `mutate()`. ## ℹ In argument: `Date = mdy(Date)`. ## Caused by warning: ## ! All formats failed to parse. No formats found. ``` ``` ## Date n ## Min. :2012-01-01 Min. : 0.0 ## 1st Qu.:2014-09-08 1st Qu.: 0.0 ## Median :2017-05-16 Median : 0.0 ## Mean :2017-05-16 Mean : 168.6 ## 3rd Qu.:2020-01-22 3rd Qu.: 0.0 ## Max. :2022-09-30 Max. :661945.0 ## NA's :1 ``` -->